|
Back to disease list
|
| Total # of GERD/NERD Patients (PatientsMap 2012 US Nationwide Projection) |
|
|
| Estimated # of pts |
|
| 15,569,501 |
- Overall |
|
| 11,255,338 |
- Overall (FP excluded) |
|
|
|
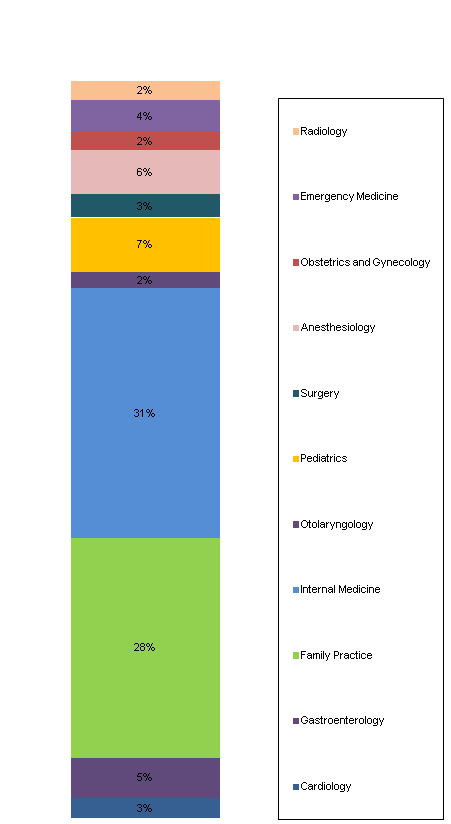
Pt share by specialty
of department (2% or above)
|
|
% of physicians
|
|
|
|
|
| |
| |
# of
respondent physicians |
1pts/month or more |
5pts/month or more |
Avg.
# of pts |
| # of physicians |
% of Tx |
# of physicians |
% of Tx |
| Hematology and Oncology |
319 |
147 |
46% |
129 |
40% |
8.1 |
| Rheumatology |
112 |
54 |
48% |
50 |
45% |
16.6 |
| Endocrinology |
126 |
49 |
39% |
44 |
35% |
9.2 |
| Cardiology |
299 |
164 |
55% |
154 |
52% |
16.2 |
| Infectious Disease |
111 |
48 |
43% |
38 |
34% |
8.8 |
| Nephrology |
115 |
66 |
57% |
60 |
52% |
17.1 |
| Neurology |
293 |
36 |
12% |
29 |
10% |
2.5 |
| Gastroenterology |
170 |
165 |
97% |
164 |
96% |
57.8 |
| Allergy and Immunology |
98 |
79 |
81% |
72 |
73% |
20.7 |
| Dermatology |
198 |
5 |
3% |
3 |
2% |
0.6 |
| Family Practice |
780 |
768 |
98% |
741 |
95% |
39.3 |
| Urology |
121 |
6 |
5% |
5 |
4% |
0.9 |
| Psychiatry |
422 |
64 |
15% |
54 |
13% |
3.6 |
| Pulmonology |
113 |
83 |
73% |
78 |
69% |
27.8 |
| Internal Medicine |
632 |
612 |
97% |
597 |
94% |
41.7 |
| Otolaryngology |
121 |
108 |
89% |
106 |
88% |
32.0 |
| Pediatrics |
469 |
431 |
92% |
345 |
74% |
14.7 |
| Surgery |
310 |
178 |
57% |
138 |
45% |
8.0 |
| Ophthalmology |
196 |
5 |
3% |
4 |
2% |
1.7 |
| Anesthesiology |
144 |
73 |
51% |
70 |
49% |
19.6 |
| Obstetrics and Gynecology |
275 |
143 |
52% |
124 |
45% |
8.2 |
| Emergency Medicine |
203 |
191 |
94% |
176 |
87% |
17.9 |
| Orthopedics |
83 |
7 |
8% |
5 |
6% |
0.8 |
| Radiology |
123 |
53 |
43% |
47 |
38% |
9.6 |
|
|
|
|
|
|
|
| Overall |
5833 |
3535 |
61% |
3233 |
55% |
19.1 |
| Overall (FP excluded) |
5053 |
2767 |
55% |
2492 |
49% |
16.0 |
|

